Read your reports
The Reports workspace pulls your loans, carriers, and caregivers into five focused reports you can filter, group, and sort. Everything is scoped to what you’re allowed to see, so a report never shows records outside your access. Any member who can see the underlying data can read the reports; the workspace itself needs the Pro plan or above.
The Reports workspace is available on Pro and Plus. On Free and Starter it shows an upgrade prompt instead of the workspace. The dashboard counts, the usage meter, and the overdue list are available on every tier, so you can track day-to-day activity without the workspace. Reports are also paused while an organization is over its plan limit.
The five reports
Switch between reports with the report picker at the top of the workspace.
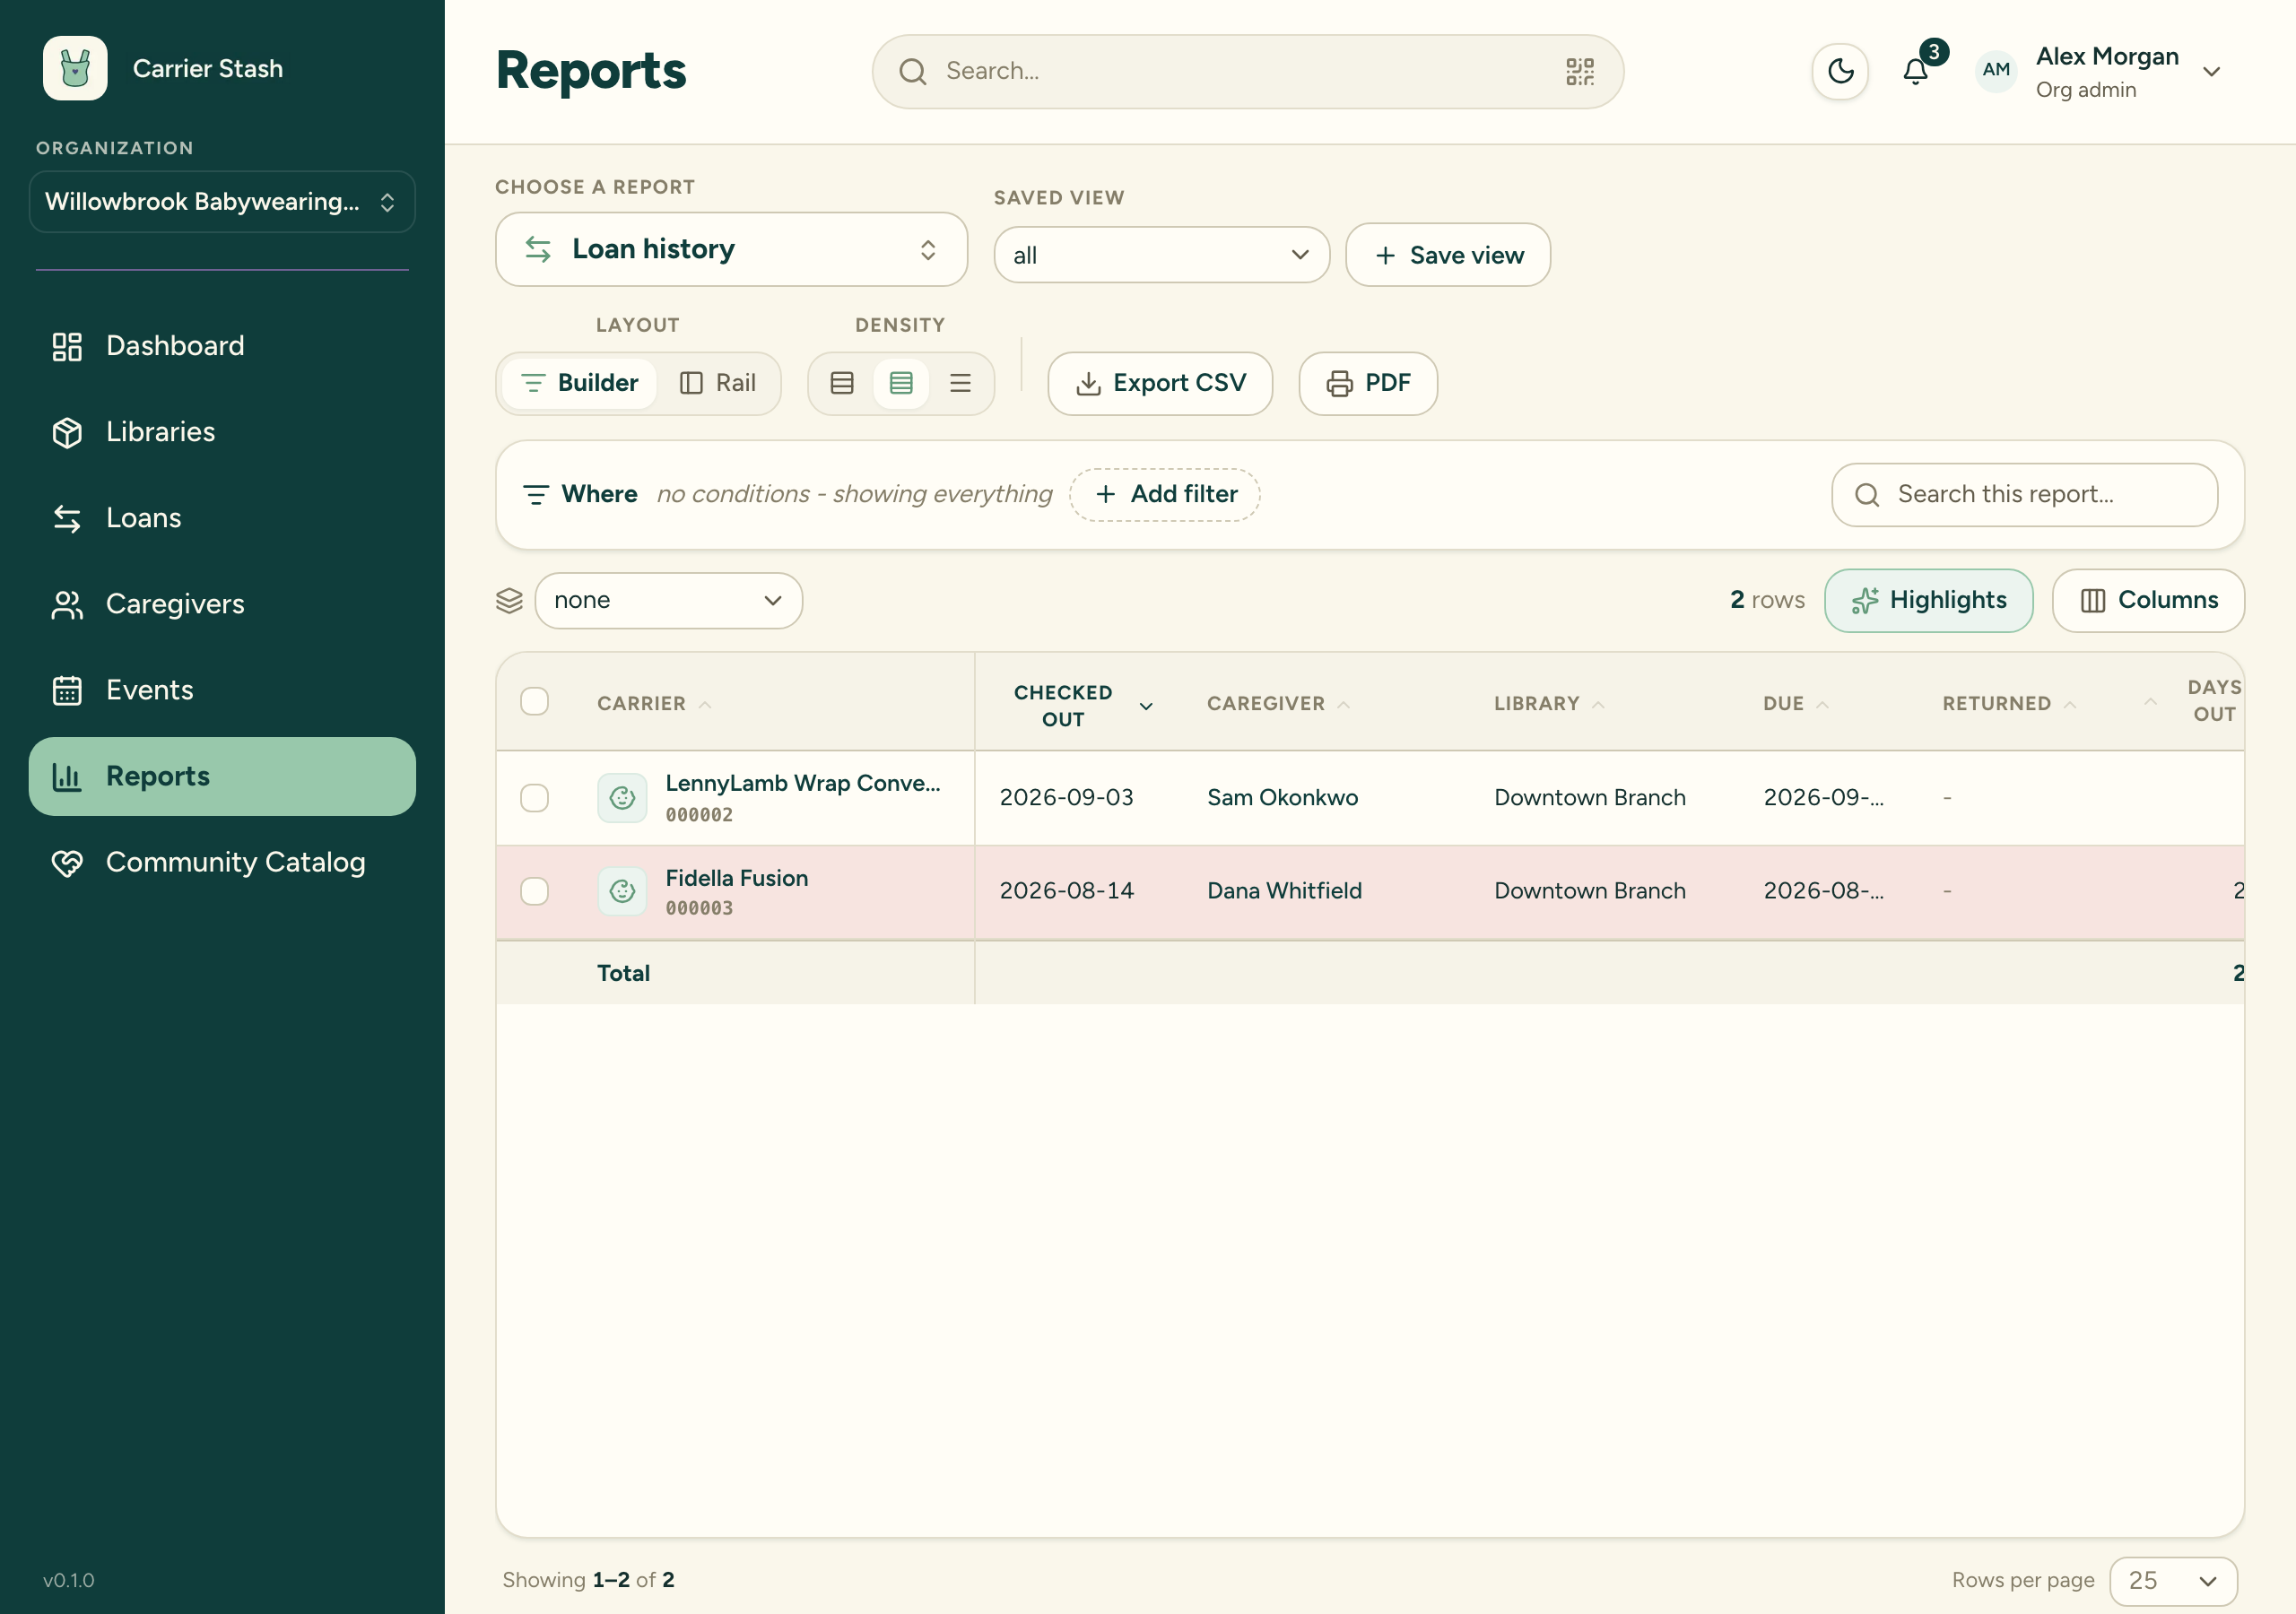
- Loan history — every check-out and return across all libraries, with due dates, return dates, days out, and outcome (on time, returned late, active, or overdue).
- Overdue & due back — open loans that are late or coming due, sorted so the most overdue rise to the top, with caregiver phone and email for follow-up.
- Carrier utilization — usage stats per carrier: lifetime loans, so you can see which carriers are the most borrowed and most popular versus your shelf-sitters, along with each carrier’s last check-out date.
- Caregiver activity — borrowing history and standing per caregiver: active loans now, late returns, lifetime loans, and whether they’re in good standing, on watch, or blocked. Blocked means the caregiver has an active Do Not Lend flag. On watch means either any other active flag (damage history, overdue history, or “see note”), or more than one late return (two or more). Everyone else is in good standing. A Do Not Lend flag always shows as Blocked, no matter the late count.
- Condition log — inspection history for each carrier, showing the condition before and after each event and any issue noted at check-in.
Working with a report
Filter and search
Use the filters (called facets) down the side to narrow by things like library, carrier type, brand, condition, or outcome. Each facet shows a live count. The search box matches text across the visible columns.
Set a date range
Reports with a date column can be limited to a relative range — the last 30 or 90 days, the current year, or all time. The range filters that report’s own primary date column — for Loan history that’s the check-out date. Dates are stored in UTC and shown in your browser’s local time, and the range is measured against the calendar date.
Group and subtotal
Group rows by a column such as library, caregiver, or carrier type. Numeric columns roll up into per-group subtotals and a total at the bottom.
Sort and choose columns
Sort by any column, and use the columns menu to show or hide columns. Each report opens with a sensible default sort — for example, Overdue & due back leads with the most days late.
Saved views
Apply a one-click preset (for example “Overdue & late” on Loan history or “Shelf-sitters” on Carrier utilization) to jump to a common filter-and-sort combination. You can also save your own views.
Exporting
Any report can be exported to CSV or printed to PDF from the workspace toolbar — see Export to CSV for the details, including the separate carrier and caregiver exports.